One of the pitfalls of using Excel when connecting it to a database that has a large amount of data, such as SKUtrak DataShare, is that it can be slow and problematic when Excel brings back a large number of rows. This is particularly the case when using Excel with the Snowflake database, as is used by SKUtrak, and when retrieving daily data for stores. If products are stocked in 500 stores, you have 10 different SKUs, that is 5000 rows of data per day that needs to brought back to your spreadsheet. If you have 100 SKUs and want to look at store data over 1 week, that is now 350,000 rows, and so you can being to understand why it gets a little slow and your spreadsheets get a bit big.
But there is another problem that has a big impact on performance and often makes it impossible to use the DataShare store data in the normal way in Excel Power Query. If you are technically minded and interested in the detailed technical explanation as to why this happens, read this article.
Thankfully there is a way of avoiding this issue and being able to use Excel with large data tables, such as daily store data, and getting data loading really quickly without any errors.
It can look a bit daunting, and unless you happen to be proficient in writing SQL queries, you probably would avoid it. But using this guide, and with some template SQL queries that you can copy and paste, you can get the data you need without needing to learn SQL.
ODBC Connection with SQL Statement
First you need get your ODBC connect to your SKUtrak DataShare database in the normal way.
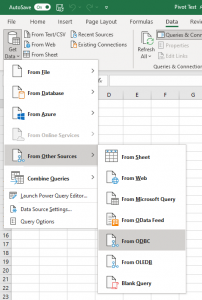
From the Data ribbon, select the “Get Data” icon, then “From Other Sources” and select “From ODBC“
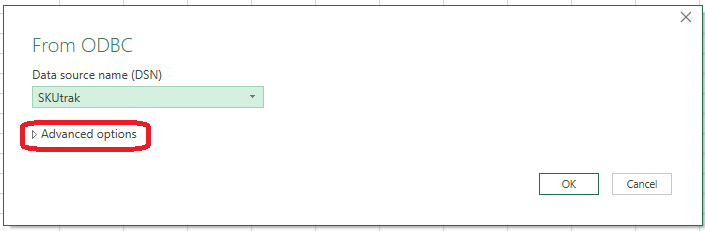
When you see the next window, you need to select the Data Source Name (your ODBC data source you will have created separately), but now you need to stop, do not click on OK. Instead, click on the Advanced options item to expand that window.
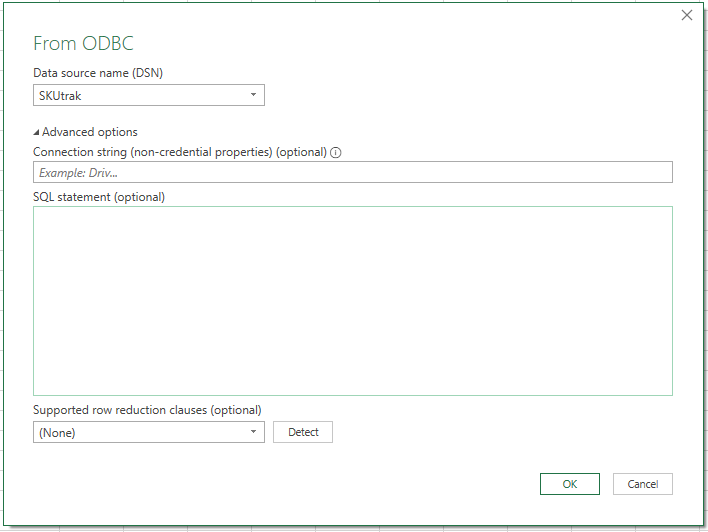
Now you will see a big box titled “SQL statement (optional)“, which is where you need to paste in the appropriate SQL.
As an example, copy and paste the SQL statement from further down this page.
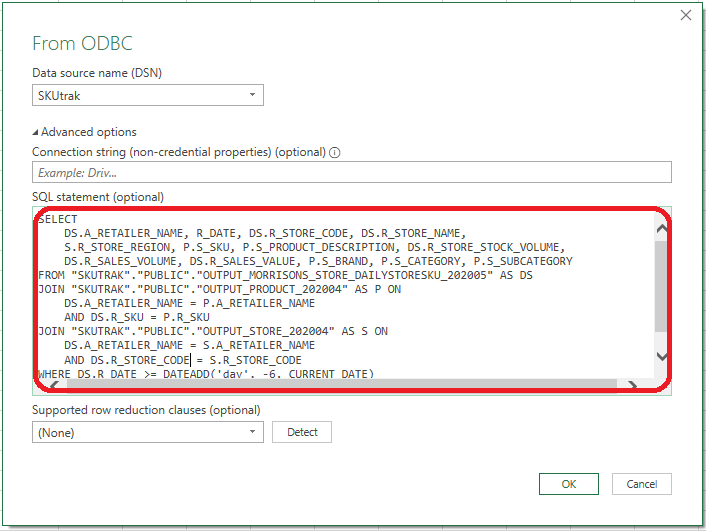
Once you’ve pasted it in, now you can click OK.
If it is the first time using the DataShare ODBC driver you will be prompted for username and password, but otherwise you will be taken to the sample data page.
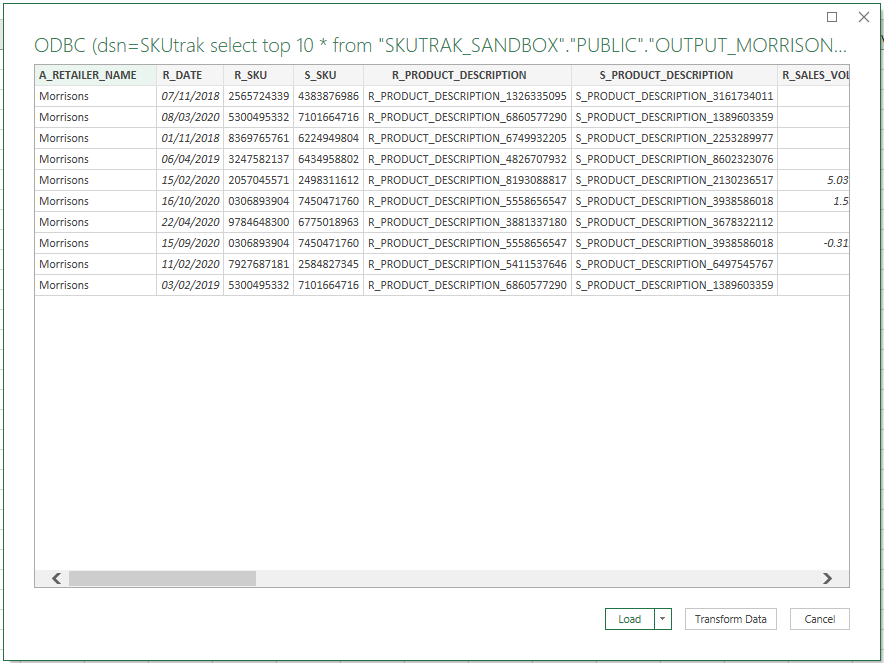
Normally, you would have seen a list of tables at this point and then probably clicked on the “Transform Data” button. But the SQL that has been pasted in should return exactly the data you need, so there is no need to do any further “Transform”, and instead you can click on “Load“.
Now you have got the connection to the right set of data from DataShare, and you can create a pivot or load the data into a table in a worksheet in Excel.
When you hit “Refresh All” to refresh the data in Excel, you will notice that even though you are connected to the large daily store table, it is still very quick and the amount of data downloaded is not so significant.
Past 5 days Store Data for Morrisons
The query below will limit the amount of data being returned to just the past 5 days (based on current date when the spreadsheet is refreshed), and also brings back the product category information for each SKU, and store name and region for each store. From the daily store data table it brings back the daily stock volume for each store, sales volume and sales value.
SELECT
    DS.A_RETAILER_NAME, R_DATE, DS.R_STORE_CODE, DS.R_STORE_NAME,
    S.R_STORE_REGION, P.S_SKU, P.S_PRODUCT_DESCRIPTION, DS.R_STORE_STOCK_VOLUME,
    DS.R_SALES_VOLUME, DS.R_SALES_VALUE, P.S_BRAND, P.S_CATEGORY, P.S_SUBCATEGORY
FROM "SKUTRAK"."PUBLIC"."OUTPUT_MORRISONS_STORE_DAILYSTORESKU_202005" AS DS
JOIN "SKUTRAK"."PUBLIC"."OUTPUT_PRODUCT_202004" AS P ON
    DS.A_RETAILER_NAME = P.A_RETAILER_NAME
    AND DS.R_SKU = P.R_SKU
JOIN "SKUTRAK"."PUBLIC"."OUTPUT_STORE_202004" AS S ON
    DS.A_RETAILER_NAME = S.A_RETAILER_NAME
    AND DS.R_STORE_CODE = S.R_STORE_CODE
WHERE DS.R_DATE >= TO_DATE(DATEADD('day', -5, SYSDATE()))
ORDER BY DS.R_DATE DESC
You can modify the query to add more columns from the daily store table, for example if you also want to see wastage volume, add the text ,DS.R_WASTAGE_VOLUME after the S_SUBCATEGORY
If you want to show the last 10 days data, change the -5 to -10 on the second to bottom line.