It is very straight forward to go from having nothing, to having your SKUtrak data loaded in an Excel spreadsheet on your desktop. But it is even easier if you can watch someone else show you how to do it, step by step.
Follow the videos below to fast track getting your data loaded.
Before doing anything in Excel, you must first install the Snowflake ODBC drivers and setup an ODBC connection.
Pivot tables are a must-have for building reports and dashboards in Excel. In this video, we will build a pivot table showing product sales, linked directly to SKUtrak DataShare. The power of having a direct link from the pivot table to DataShare is that once you’ve built the spreadsheet, to update the data you only need to click “Refresh” in Excel, and the latest data will be downloaded and the pivot refreshed.
In order to see data organised by product category or product brand, you need to connect to more than one table in DataShare and join them together. In this video we show you how to do that in Microsoft Power Query from Excel, and also another helpful technique to apply a date filter and reduce the amount of data downloaded into the spreadsheet.
We end up with a pivot showing daily sales figures for the past 4 weeks, split by product category and brand.
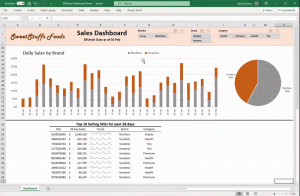
You can create a report or dashboard that shows exactly the data items that you want to see in a single page, in your corporate format, and viewable in the everyday tools that you use, such as Excel. You can refresh the data instantly, share it easily across the business, with colleagues that don’t have access to the SKUtrak app.
